Overview
I’ve always wanted to learn more about how the Ruby interpreter works, and I figured a good way is to step through the code and see what it does. Join me as I figure out how to build the source and step through it using a debugger.
We’re going to build a Docker image with a debug version of Ruby (i.e. non-optimized, with debug symbols) built and ready to run using VSCode. I picked the container approach because I think it offers a better developer experience, especially if you want to setup a one-off environment without changing anything on your local machine.
By the end of this post, we should be able to run the container, attach VSCode, pass in any ruby script, set a breakpoint, and begin debugging. Further, we can mount our own Ruby VM source code into the container and use it as a development environment to make a custom build.
Let’s get started.
Dockerfile
First, we’re going to define our image using the following Dockerfile:
# Ruby VM Dev Container - so you can compile and debug the Ruby VM at version 2.6
FROM debian:latest

RUN apt-get update && apt-get install -y \
  autoconf \
  build-essential \
  curl \
  gdb \
  git \
  procps \
  ruby \
  sudo \
  wget \
  && wget http://launchpadlibrarian.net/140087283/libbison-dev_2.7.1.dfsg-1_amd64.deb \
  && wget http://launchpadlibrarian.net/140087282/bison_2.7.1.dfsg-1_amd64.deb \
  && dpkg -i libbison-dev_2.7.1.dfsg-1_amd64.deb \
  && dpkg -i bison_2.7.1.dfsg-1_amd64.deb \
  && rm libbison-dev_2.7.1.dfsg-1_amd64.deb \
  && rm bison_2.7.1.dfsg-1_amd64.deb \
  && rm -rf /var/lib/apt/lists/*

WORKDIR /code/prebuilt
RUN git clone --depth 1 https://github.com/ruby/ruby.git -b ruby_2_6
WORKDIR /code/prebuilt/ruby
RUN autoconf && optflags='' ./configure && make install

RUN mkdir -p /code/mounted
WORKDIR /code

CMD ["bash"]
This uses Debian as the base image, adds some packages we’ll need, clones the https://github.com/ruby/ruby.git repo, then configures, makes, and installs a ruby binary without any optimizations.
To build this image, save the above file in a directory of your choice, then from that directory run:
docker build -t ruby-dev-env .
Once we’ve built the image, we can shell into it and run a debug build of ruby as follows:
docker run --rm -it --init ruby-dev-env bash
cd prebuilt/ruby
ruby --version
The image also lets us mount in our own source code to build. We can do something like:
docker run --rm -it --init -v /path/to/repo:/code/mounted/<repo> ruby-dev-env bash
cd mounted/<repo>
autoconf && ./configure && make install
At this point, we can debug with gdb, or attach VSCode and use its debugger.
Debugging with VSCode
For this post, we’re going to attach VSCode to the container we defined above, and use it as a debugger.
- Run the container we defined above by typing:
docker run --rm -it --init ruby-dev-env bash
- Open VSCode, and ensure you have the Remote Containers extension installed.
- Go to the Remote Explorer tab; you should see your running container like in the figure below:

- Attach to the container. VSCode will create a volume and initialize some of its extensions the first time you attach to the container - this may take a minute or so.
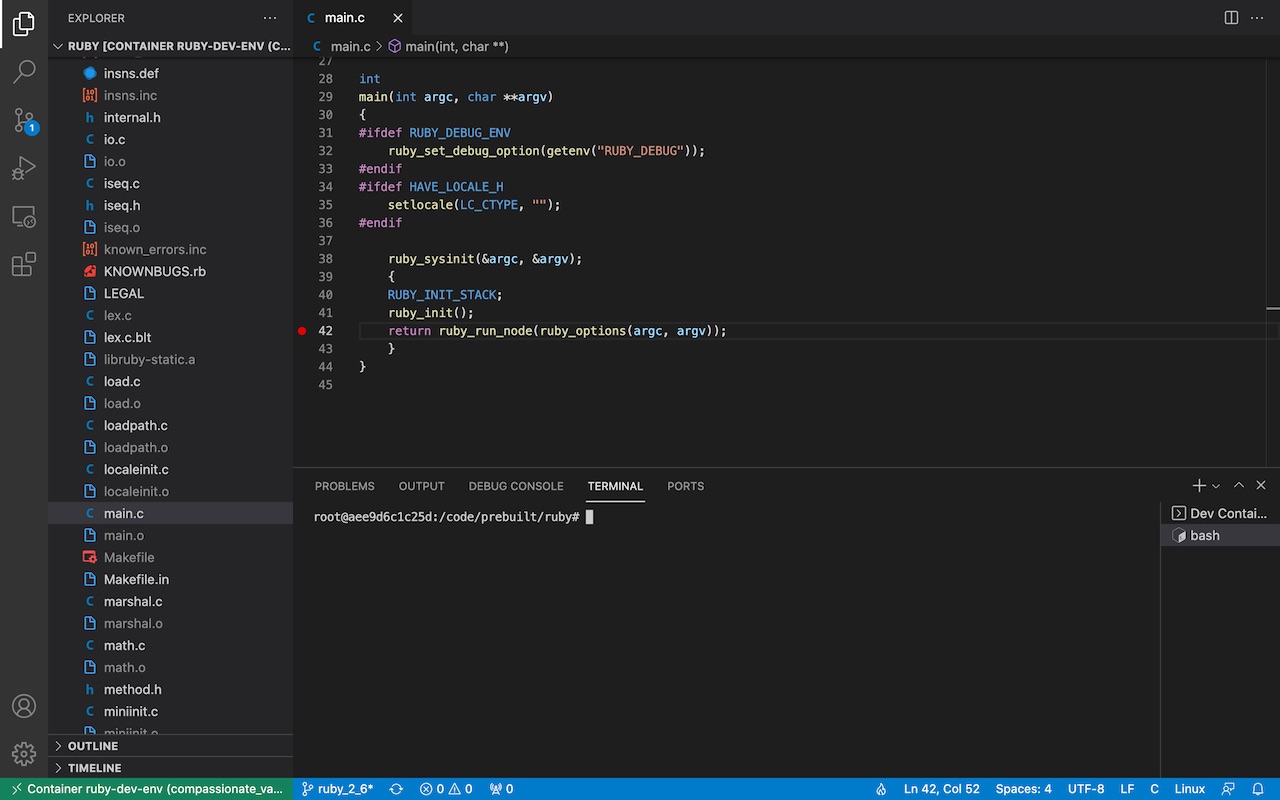
- Once attached, it should open the
/code/prebuilt/rubyfolder for you. You can open a terminal and see that you’re in the container, like in the screenshot below:
- If it doesn’t install automatically after you’ve attached to the container, make sure you have the C/C++ extension installed
- To debug, set a breakpoint (I put it on line 42 in
main.cin the above screenshot), then switch to the “Run and Debug” tab and click “Run and Debug” - It’ll ask you for an environment - choose
C++ (GDB/LLDB) - It’ll ask you for a configuration - choose
Default Configuration - It’ll create a
launch.jsonfile, that looks like the following - edit the “program” key to point to"program": "/usr/local/bin/ruby",(since we install the executable), and add a"-v"to theargsarray, and ensure your working directory (cwd) is correct.
{
  "version": "0.2.0",
  "configurations": [
    {
      "name": "(gdb) Launch",
      "type": "cppdbg",
      "request": "launch",
      "program": "/usr/local/bin/ruby",
      "args": ["-v"],
      "stopAtEntry": false,
      "cwd": "${workspaceFolder}",
      "environment": [],
      "externalConsole": false,
      "MIMode": "gdb",
      "setupCommands": [
        {
          "description": "Enable pretty-printing for gdb",
          "text": "-enable-pretty-printing",
          "ignoreFailures": true
        }
      ]
    }
  ]
}
- Press F5 to start debugging - you should the see it hit the breakpoint like so:
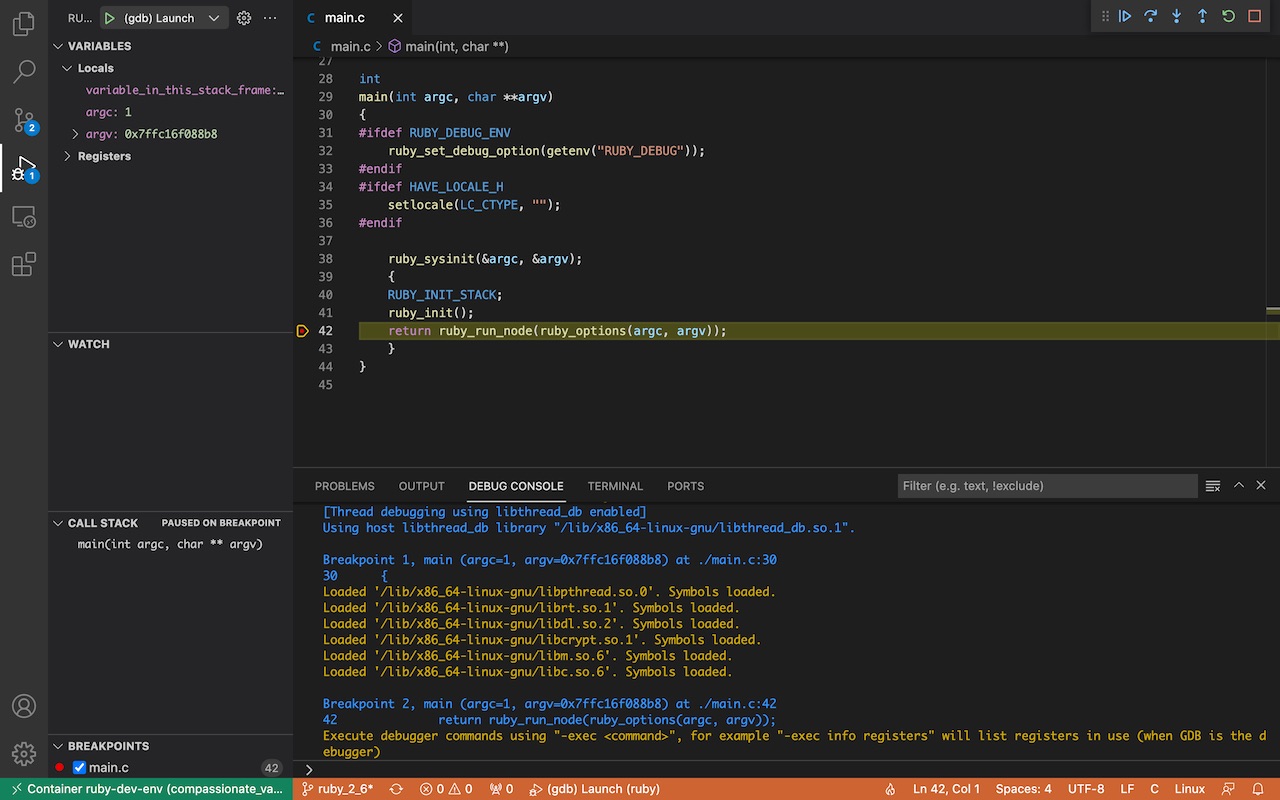
Now we can step through the code and examine variables at our leisure. Try passing in a simple ruby script into the interpreter by adding it to the "args" array in the launch.json config.
In future posts, I’ll pass in a ruby script and try to gain a bottoms-up understanding of what the interpreter is doing by stepping through the code and identifying functional blocks.